Next: 9.1.2.1 例: 複数のグラフを plot Up: 9.1 Cから gnuplot を呼び出す Previous: 9.1.1 関数を plot する
計算データを元にある程度複雑なグラフを描くには、 データファイルを作成して、それを plot するのが良いでしょうが (後述)、 plot '-' オプション として、 データを標準入力から読むように指定することも出来ます。
| testcallgnuplot.c |
/*
 * testcallgnuplot.c
 */

#include <stdio.h>
#include <math.h>

int main(void)
{
  int i, n;
  double pi, x, dx;
  FILE *gp;
  char buf[BUFSIZ];

  pi = 4.0 * atan(1.0);
  gp = popen("gnuplot", "w");
  fprintf(gp, "plot '-' with linespoints\n");
  n = 100;
  dx = 2 * pi / n;
  for (i = 0; i <= n; i++) {
    x = i * dx;
    fprintf(gp, "%f %f\n", x, sin(x));
  }
  /* 行頭が 'e' だと標準入力からの読み込みを終了 */
  fprintf(gp, "e\n");
  fflush(gp);

  /* 行入力を待つ --- Enterを打つまで待つ */
  fgets(buf, sizeof(buf), stdin);
  pclose(gp);
  return 0;
}
|
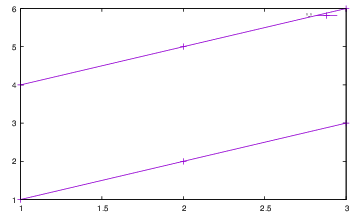
線を途中で切るには改行だけの行(空行)を出力します。 また最後に e だけの行を送ります。 この場合、線の色は変わらない。
| 対話的に確認 |
gnuplot> plot '-' with lp
input data ('e' ends) > 1 1
input data ('e' ends) > 2 2
input data ('e' ends) > 3 3
input data ('e' ends) >
input data ('e' ends) > 1 4
input data ('e' ends) > 2 5
input data ('e' ends) > 3 6
input data ('e' ends) > e
|
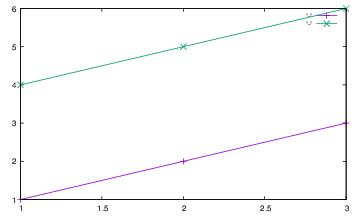
次のように2つのものの plot とすると、線の色が変わります。
| 対話的に確認 |
gnuplot> plot '-' with lp, '-' with lp
input data ('e' ends) > 1 1
input data ('e' ends) > 2 2
input data ('e' ends) > 3 3
input data ('e' ends) > e
input data ('e' ends) > 1 4
input data ('e' ends) > 2 5
input data ('e' ends) > 3 6
input data ('e' ends) > e
|