Next: 11.5 模式図 Up: 11 TikZ Previous: 11.3 いろは
plot という命令で曲線 (折れ線?) が描ける。
座標を記録したファイルを用意しておいて plot file {ファイル名}; とすることも出来る。
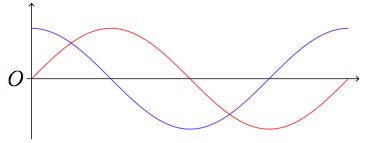
\begin{tikzpicture}[=>stealth]
 \draw node (0,0) [left] {$O$};
 \draw [->] (-0.1,0) -- (6.5,0);
 \draw [->] (0,-1.2) -- (0,1.5);
 \draw [red] plot file {sin.tbl};
 \draw [blue] plot file {cos.tbl};
\end{tikzpicture}
|
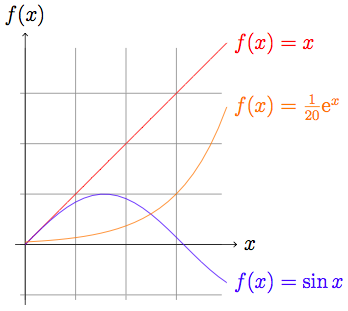
\begin{tikzpicture}[domain=0:4]
 \draw[very thin,color=gray] (-0.1,-1.1) grid (3.9,3.9);
 \draw[->] (-0.2,0) -- (4.2,0) node[right] {$x$};
 \draw[->] (0,-1.2) -- (0,4.2) node[above] {$f(x)$};
 \draw[color=red] plot[id=x] function{x} node[right] {$f(x) =x$};
 \draw[color=blue] plot[id=sin] function{sin(x)} node[right]
   {$f(x)=\sin x$};
 \draw[color=orange] plot[id=exp] function{0.05*exp(x)}	node[right]
   {$f(x) = \frac{1}{20} \mathrm e^x$};
\end{tikzpicture}
|
これで一度組版すると、 なんとか.x.gnuplot, なんとか.sin.gnuplot, なんとか.exp.gnuplot というファイルが出来る。それぞれ gnuplot で実行する。
gnuplot なんとか.x.gnuplot gnuplot なんとか.sin.gnuplot gnuplot なんとか.exp.gnuplot |